
Player Profile Lab: The Average Player Does Not Exist

📌 TL;DR
Player Profile Lab turns a hand-history database into a live population research environment.
Instead of asking how the average player behaves, you can:
- 🧬 Explore built-in Fish, Reg, Whale, Nit, TAG, and LAG populations
- 🗺️ Map any two of 50+ player stats against each other
- 🧪 Build a Custom Profile with live AND conditions and a minimum-hands floor
- 🔬 Compare the selected profile's complete fingerprint against All Players
- 🎯 Apply the profile across Preflop and Postflop reports—or use a different profile on the Reference to compare
A population average is useful right up until two opposite mistakes cancel each other out.
Player Profile Lab separates the players before you build the exploit.
🩸 The Problem: Population Averages Hide the Player You Face
Imagine a pool where half the players fold to a flop bet 65% of the time and the other half fold only 30%.
The pool average says 47.5%.
But nobody in that example actually plays 47.5%.
One group is giving up too much. The other is continuing too wide. If you study only the blended number, you build one strategy against two completely different opponents—and miss both exploits.
Traditional HUD labels do not solve this. A static tag such as loose passive tells you what somebody was called, not:
- how that group was defined,
- whether the sample is reliable,
- how its postflop behaviour differs from the baseline,
- or whether the same population is actually profitable to attack.
Player Profile Lab makes the definition, distribution, sample quality, and downstream report filter part of one workflow.
🧬 Built-in Profiles: Start With a Population, Not a Stereotype
The Lab opens with an exhaustive population anchor:
- Reg — the stable regular population, classified within its exact site, stake, and table format
- Fish — every scoped player outside the Reg definition
- All Players — the complete baseline
Fish and Reg therefore cover the whole scoped population without an ambiguous middle bucket.
You can then add orthogonal behavioural tags:
- Whale — extremely loose participation
- Nit — unusually tight participation
- TAG — tight-aggressive
- LAG — loose-aggressive
These are not global labels attached to a player forever. The same player can behave differently at another stake, site, or table format, so Maxploit evaluates the exact player scope used by the report.
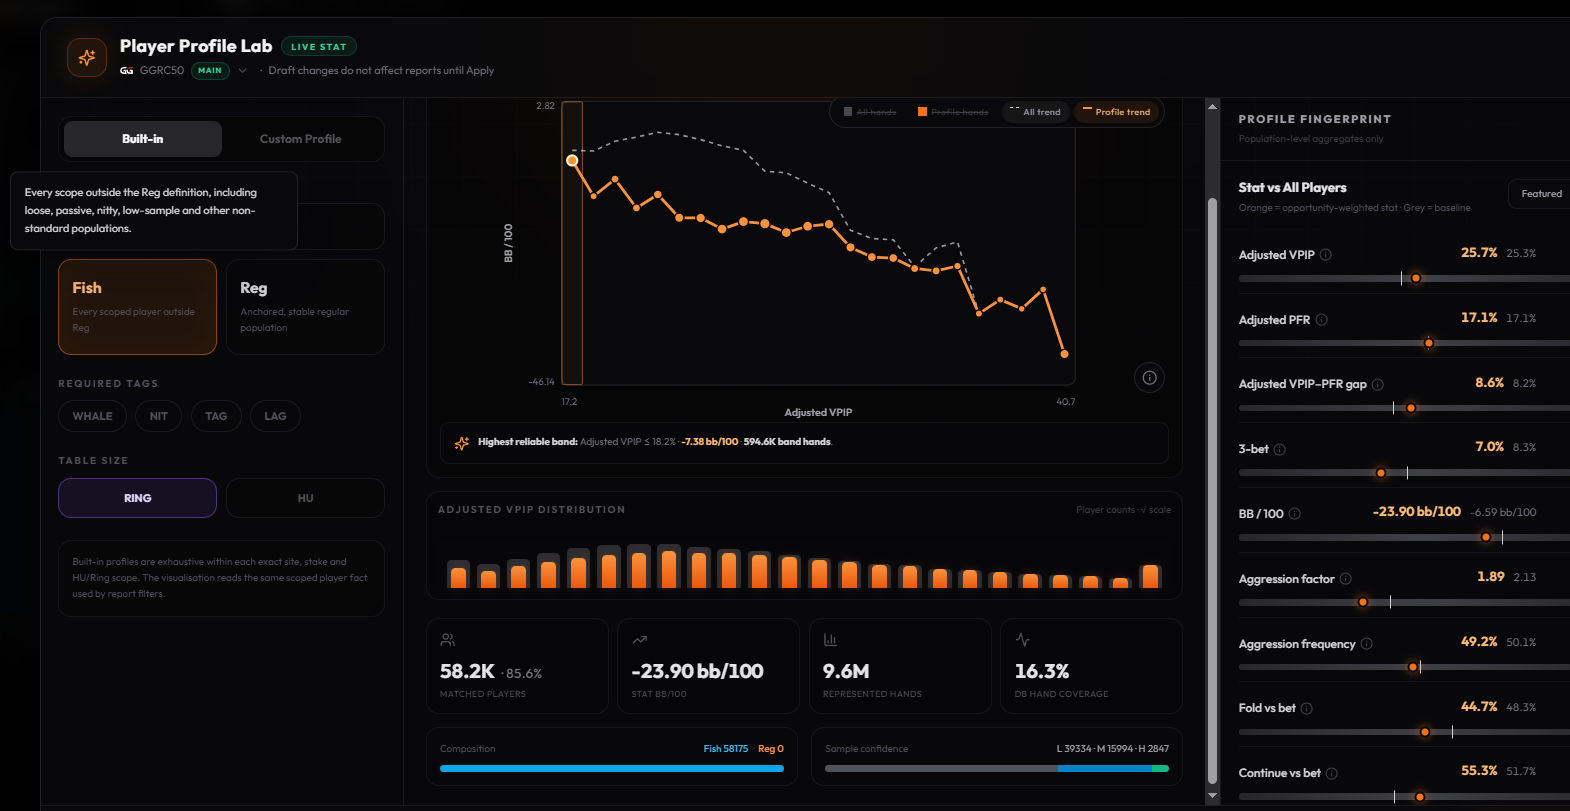 Built-in Fish profile: the orange profile trend and fingerprint are compared directly against the grey All Players baseline.
The Ring and HU models are isolated as well. A player's heads-up style never leaks into the Ring classification—or the other way around.
🗺️ Population Map: See Where the Player Pool Actually Lives
The centre of the Lab is a live two-dimensional population map.
Choose any pair from more than 50 player metrics:
- Adjusted VPIP, PFR, VPIP–PFR gap, and 3-bet
- AF and AFq, overall or by street
- Fold, Call, Raise, and Continue vs Bet
- C-bet, Fold to C-bet, and Check-raise
- Donk and Probe frequencies
- WWSF, WTSD, and W$SD
- BB/100 and average investment
The map then answers a more useful question than a leaderboard ever could:
"When this population moves along X, what happens to Y—and is that relationship different from everybody else?"
Read the map in four layers
- Grey density shows where All Players are concentrated.
- Orange density shows where the selected profile contributes hands.
- Grey dashed trend is the All Players baseline across each X band.
- Orange solid trend is the profile's hands-weighted Y value.
You can toggle every layer independently, move between the density map and X distribution, and pin a trend band for closer inspection.
The chart also protects you from the two most common population-analysis traps:
- Outliers: the visible domain uses a robust P2–P98 range, while edge samples remain counted instead of stretching the entire chart.
- Tiny samples: the reliability floor, represented hands, DB coverage, and low/medium/high confidence composition stay visible next to the result.
The result is not merely where players are. It is where the reliable mass of the selected player pool is—and how its outcomes change across that mass.
🧪 Custom Profiles: Turn a Read Into a Testable Definition
Built-in profiles are the starting point. Custom Profiles are where a poker hypothesis becomes measurable.
Suppose your read is:
"Very loose players with a wide VPIP–PFR gap are not just recreational—they are specifically loose-passive and too sticky postflop."
Create a profile with:
- A minimum sample floor
- Adjusted VPIP above your threshold
- A wide VPIP–PFR gap
- A low aggression factor
- A high Continue vs Bet frequency
Every condition must match. As you edit a bound, the population map, distribution, coverage, confidence mix, and fingerprint update together.
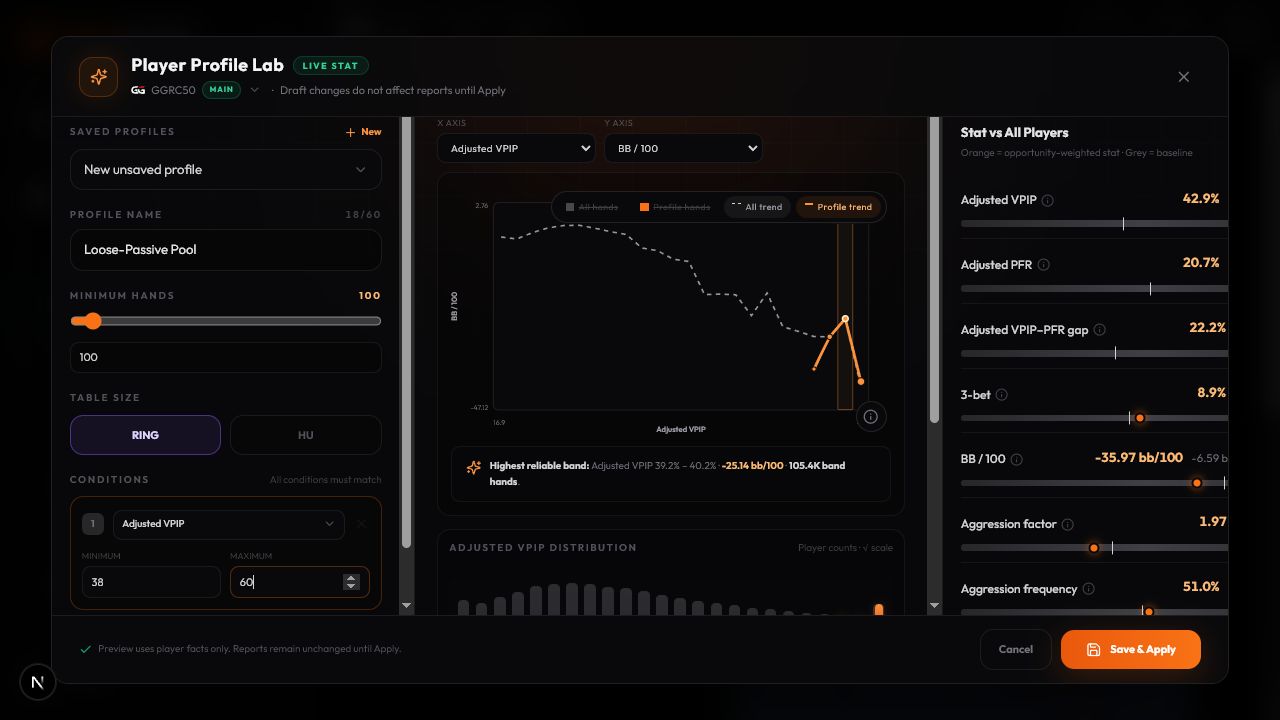 A Custom Profile preview updates live as the VPIP bounds change. The report remains untouched until Save & Apply.
Drafting and applying are deliberately separate:
- Experiment freely inside the Lab
- Inspect whether the selected player pool is large and reliable enough
- Save only definitions worth returning to
- Apply only when you want the report population to change
Clicking outside the Lab closes the draft; it does not silently alter your analysis.
🔬 Profile Fingerprint: One Profile, Every Relevant Stat
A two-axis chart can reveal a relationship, but it cannot describe a population by itself.
The Profile Fingerprint compares the selected profile with All Players across grouped metric families:
- Core
- Aggression
- Stickiness
- C-bet
- Fold to C-bet
- Check-raise
- Donk
- Probe
- Showdown
- Investment
Orange marks the profile statistic. Grey marks the baseline. The delta tells you the direction and magnitude of the difference.
Crucially, rate metrics are calculated from accumulated events and opportunities. Maxploit does not average a collection of player-level percentages and pretend every 100-hand player deserves the same weight as a 100,000-hand player.
That distinction matters whenever you filter deep into a street-specific stat.
🎯 Apply a Profile Across the Entire Analysis Stack
A profile becomes truly useful when it leaves the lab.
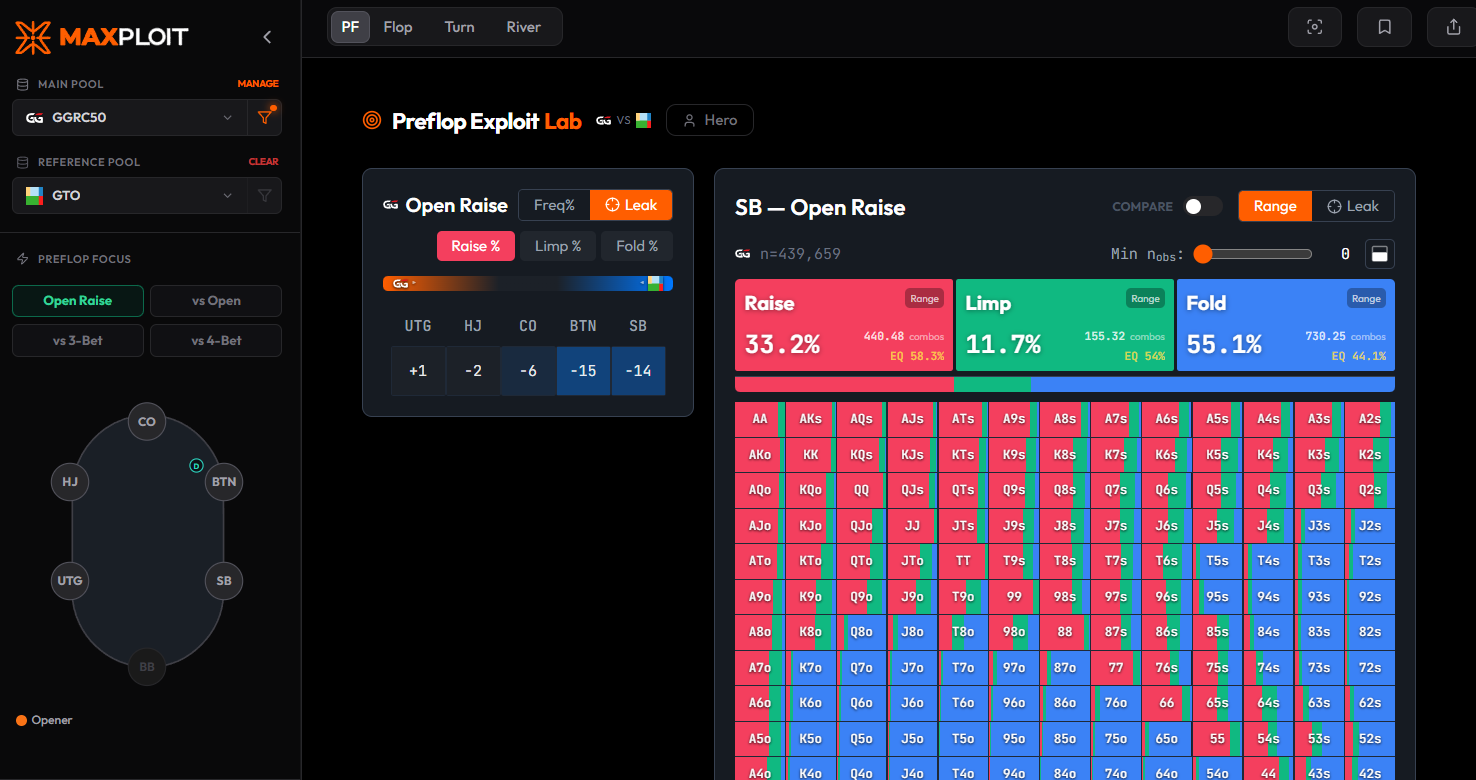 The selected profile is applied to Preflop Exploit Lab, rebuilding the position frequencies and 13×13 range from the profiled actor population.
Preflop: profile the decision-maker
Preflop reports filter the acting player at every node. Parent reach and child-node smoothing remain inside the same population, so a profiled range does not inherit frequencies from unrelated players higher in the tree.
Postflop: separate tendency from exploit EV
Postflop has two different questions:
- Tendency metrics—frequency, sizing, composition, and Action EV—profile the actor.
- Exploit metrics—Bluff EV, Nut EV, and EV Attribution—profile the facing opponent.
This is subtle and essential.
If you select Fish, a betting-frequency row answers "How often do Fish take this action?" A Bluff EV row answers "How profitable is this action when the opponent is a Fish?"
Main and Reference can study different profiled populations
Main Pool and Reference Pool keep independent profile selections. That unlocks comparisons such as:
- Fish vs Reg in the same database
- Your pool's Regs vs a higher-stakes Reg population
- Main Hero tendencies vs a LAG Reference population
- A Custom Profile vs All Players
Profiled requests also preserve exact DB scope inside merged databases, so a same-named player in another database cannot qualify by accident.
💡 Three Exploit Studies to Run First 🔥
Case 1: Find the Sticky Recreationals
PROFILE: High adjusted VPIP + high Continue vs Bet + sufficient hands.
Map Continue vs Bet against BB/100, then open the Stickiness and Showdown fingerprints. Check whether this player pool calls too much, reaches showdown too often, and still loses heavily.
Value-bet thinner and reduce low-equity bluffs. Then apply the profile to Strategy Board to find the exact streets and sizes where their excess continuation is most expensive.
Case 2: Split "Aggressive" Into Pressure and Spew
PROFILE: High AFq, then compare WWSF and W$SD.
High aggression can mean efficient pressure or uncontrolled betting. The population map shows whether increasing AFq is paired with stronger non-showdown results—or collapsing showdown quality.
Against efficient aggression, defend nodes selectively. Against the spewy branch, widen bluff-catches and use EV Attribution to see which future responses pay for the call.
Case 3: Compare Regs Without Mixing Stakes
COMPARE: Main Reg population vs Reference Reg population.
Apply Reg independently on both sides. Use the fingerprint for the broad shape, then Preflop RangeChart and Postflop Strategy Board for node-level differences.
You can see which tendencies survive across environments—and which "reg habits" are merely artifacts of one site, stake, or table format.
🔐 Population Intelligence Without a Player Browser
Player Profile Lab is intentionally population-only.
The explorer returns aggregate fingerprints, density bins, represented hands, and confidence composition. It does not need to expose player names or turn the product into an individual-player browser.
Custom Profiles save the rule, not a frozen list of player IDs. When the database changes, the matching player population is evaluated again from the same definition.
That makes a profile reproducible, portable across compatible data scopes, and far less likely to become a stale label.
🚀 Enter the Lab
- Open Reports and choose a Main or Reference database
- Click the filter icon beside the database
- Start with Fish, Reg, or one of the required tags
- Change the X and Y axes to test a relationship
- Inspect the fingerprint and sample quality
- Build a Custom Profile when the hypothesis needs a sharper definition
- Apply it to Preflop or Postflop reports
Research access and report-application access are separated by plan, so the Lab can be used to learn how profiles work before a restricted profile is applied to production reports.
Stop building strategies against a player who exists only as an average.
Define the population. Verify the sample. Then exploit what that population actually does.